A Tale of Two Tails
Peer review is one of the strangest measurement devices in science. It produces numbers, but not quite measurements. It produces decisions, but not quite explanations. It produces text, but not always enough context to reconstruct what happened. Still, when enough public review scores are available, it becomes tempting to ask a modest statistical question: what do the scores appear to say?
This post is a small forensic exercise on the public reviewer scores for accepted papers at the NeurIPS 2023 AI4Science workshop. I queried the OpenReview API for accepted oral and poster presentations, retrieved the public Official_Review replies, and parsed the numerical prefix of the public rating field. A rating like 7: Good paper, accept contributes a score of 7. The result is not a complete view of the reviewing process. It is a view of the public trace it left behind.
That distinction matters. A public review score is not the same thing as a final decision. A final decision may reflect private discussion, reviewer confidence, area-chair judgment, topical balance, oral-session capacity, novelty, fit to the workshop, and missing or hidden reviews. The data here only say what is visible in the public record. But even with that caveat, the score distributions tell a clean story.
The basic numbers
The dataset contains 10 accepted oral papers and 143 accepted poster papers. Among those, I found 16 public scored reviews for oral papers and 212 for posters. All 10 oral papers had at least one public score; 11 accepted posters had no public scored review exposed through the retrieved API replies.
Oral reviews have a mean score of 7.81 and a median of 7.5, with scores ranging from 6 to 10. Poster reviews have a mean of 6.57 and a median of 7.0, ranging from 2 to 10. The mean difference — about 1.25 points on a ten-point scale — is not subtle. But the more interesting feature is not the mean. It is the shape.
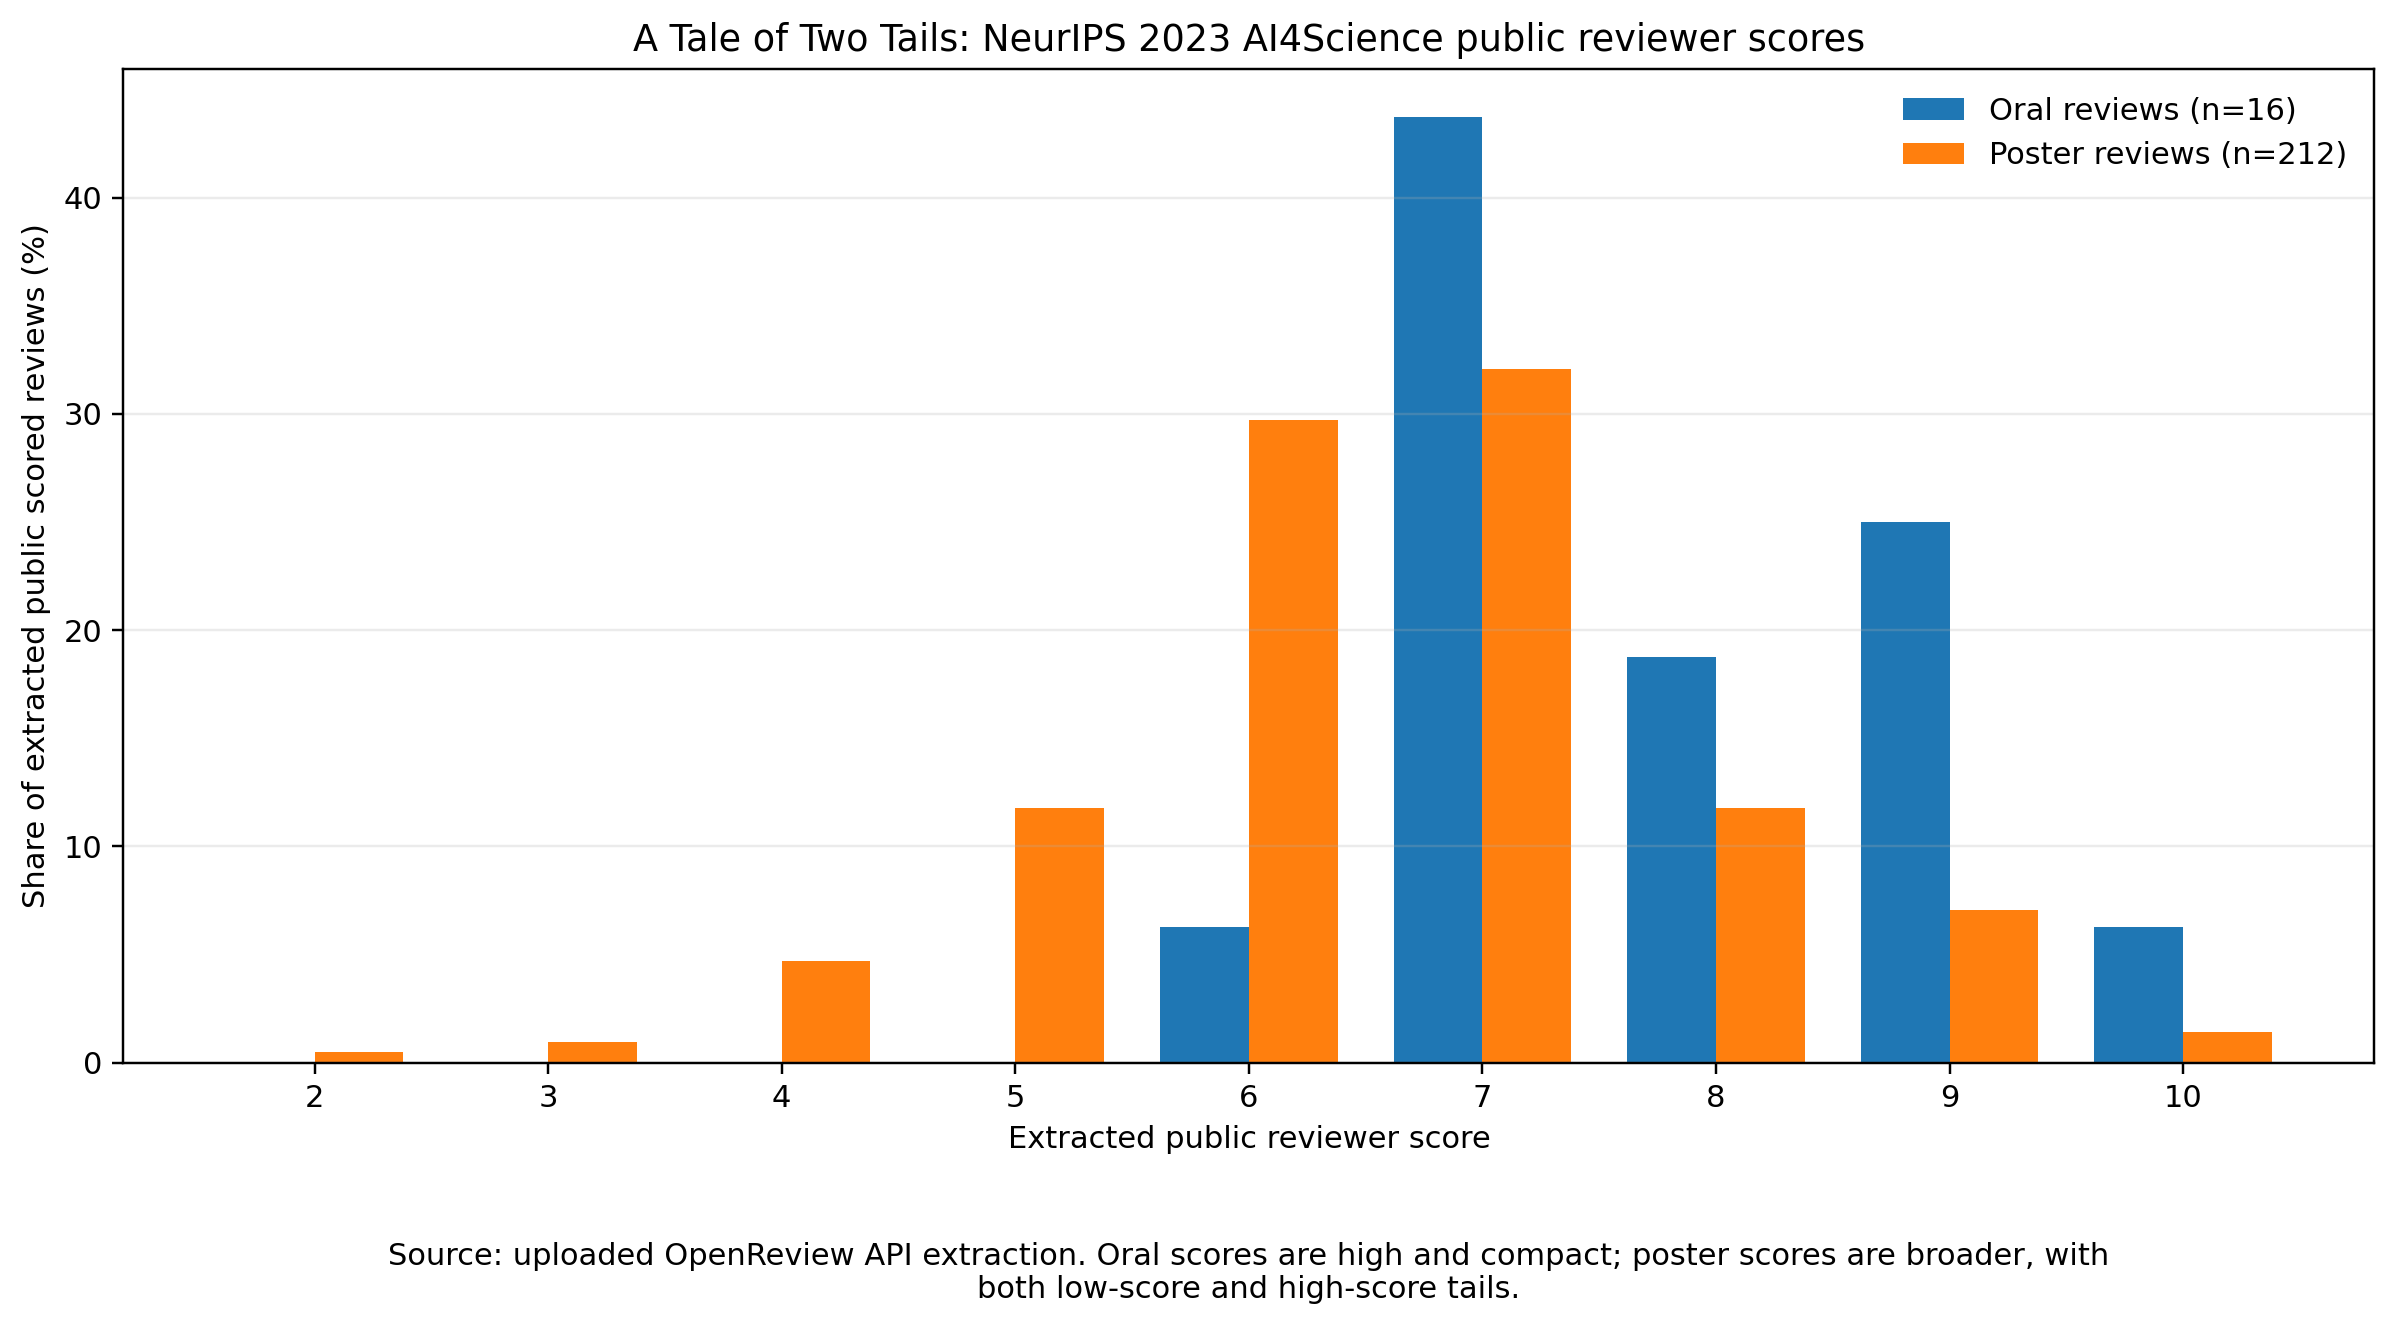
Public reviewer score distributions for accepted oral and poster papers at the NeurIPS 2023 AI4Science workshop. Bars are normalized to the share of public scored reviews within each presentation type.
The missing lower tail of oral papers
The oral score distribution is compact and high. Of the 16 public scores attached to oral papers, 15 are at least 7. The only score below 7 is a single 6. There are no oral scores of 5 or below. Scores of 8 or higher account for 8 of the 16 oral reviews.
This does not mean that every oral paper was reviewed as spectacular. The most common oral score is, perhaps surprisingly, 7 — not 9 or 10. What the distribution says is slightly different: oral papers are consistently on the acceptable-to-strong side of the public scoring scale. They lack the weak-score tail that appears among posters.
That is why “A Tale of Two Tails” feels like the right title. The oral distribution has an upper tail, but almost no lower tail. It is a selected-looking distribution: not necessarily perfect, but cleanly trimmed of low public scores.
The broad posterior of posters
The poster distribution is broader. Most poster reviews are still positive: scores 6 and 7 dominate the histogram, with 63 sixes and 68 sevens. Together those 131 reviews account for about 62 percent of the 212 public poster scores.
That concentration makes sense for accepted posters. These are not rejected papers, and a cluster around accept-like scores is exactly what we should expect. But unlike the oral distribution, the poster distribution has a real lower tail: 38 poster scores at or below 5. It also has a non-negligible upper tail: 43 poster scores of 8 or higher. Posters are not simply “lower-quality orals.” They are a heterogeneous set.
That heterogeneity is important. The poster bucket includes papers that look, by public scores alone, close to oral papers. It also includes papers with middling scores, papers with low public scores, and papers with highly mixed reviewer reactions. In other words, “poster” is not a narrow quality label. It is a broad decision category.
High-scoring posters are real
One tempting but wrong reading would be: oral means high score, poster means lower score. The data resist that simplification. Several poster papers received high public scores. Some have public mean scores of 8.0, 8.5, or 9.0. A few have pairs like 9 and 9. Others have a single visible score of 9 or 10.
This matters because oral slots are scarce. A workshop can accept many posters but only a limited number of talks, so the oral/poster distinction cannot be a simple score threshold. If it were, every high-scoring poster would be puzzling. The more plausible reading is that reviewer score is one strong signal among several constraints.
The safer statement is therefore: public reviewer scores are consistent with oral papers being drawn from the high-score end of the accepted-paper pool, but they do not uniquely determine the final assignment.
Reviewer disagreement lives mostly among posters
The per-paper score table tells a complementary story about disagreement. Among oral papers with more than one public scored review, score ranges are small — only 0 or 1 point. Among posters, the range can be much larger. There are poster papers with public score pairs like 4 and 9, 5 and 10, 9 and 2, 6 and 10, and 3 and 7.
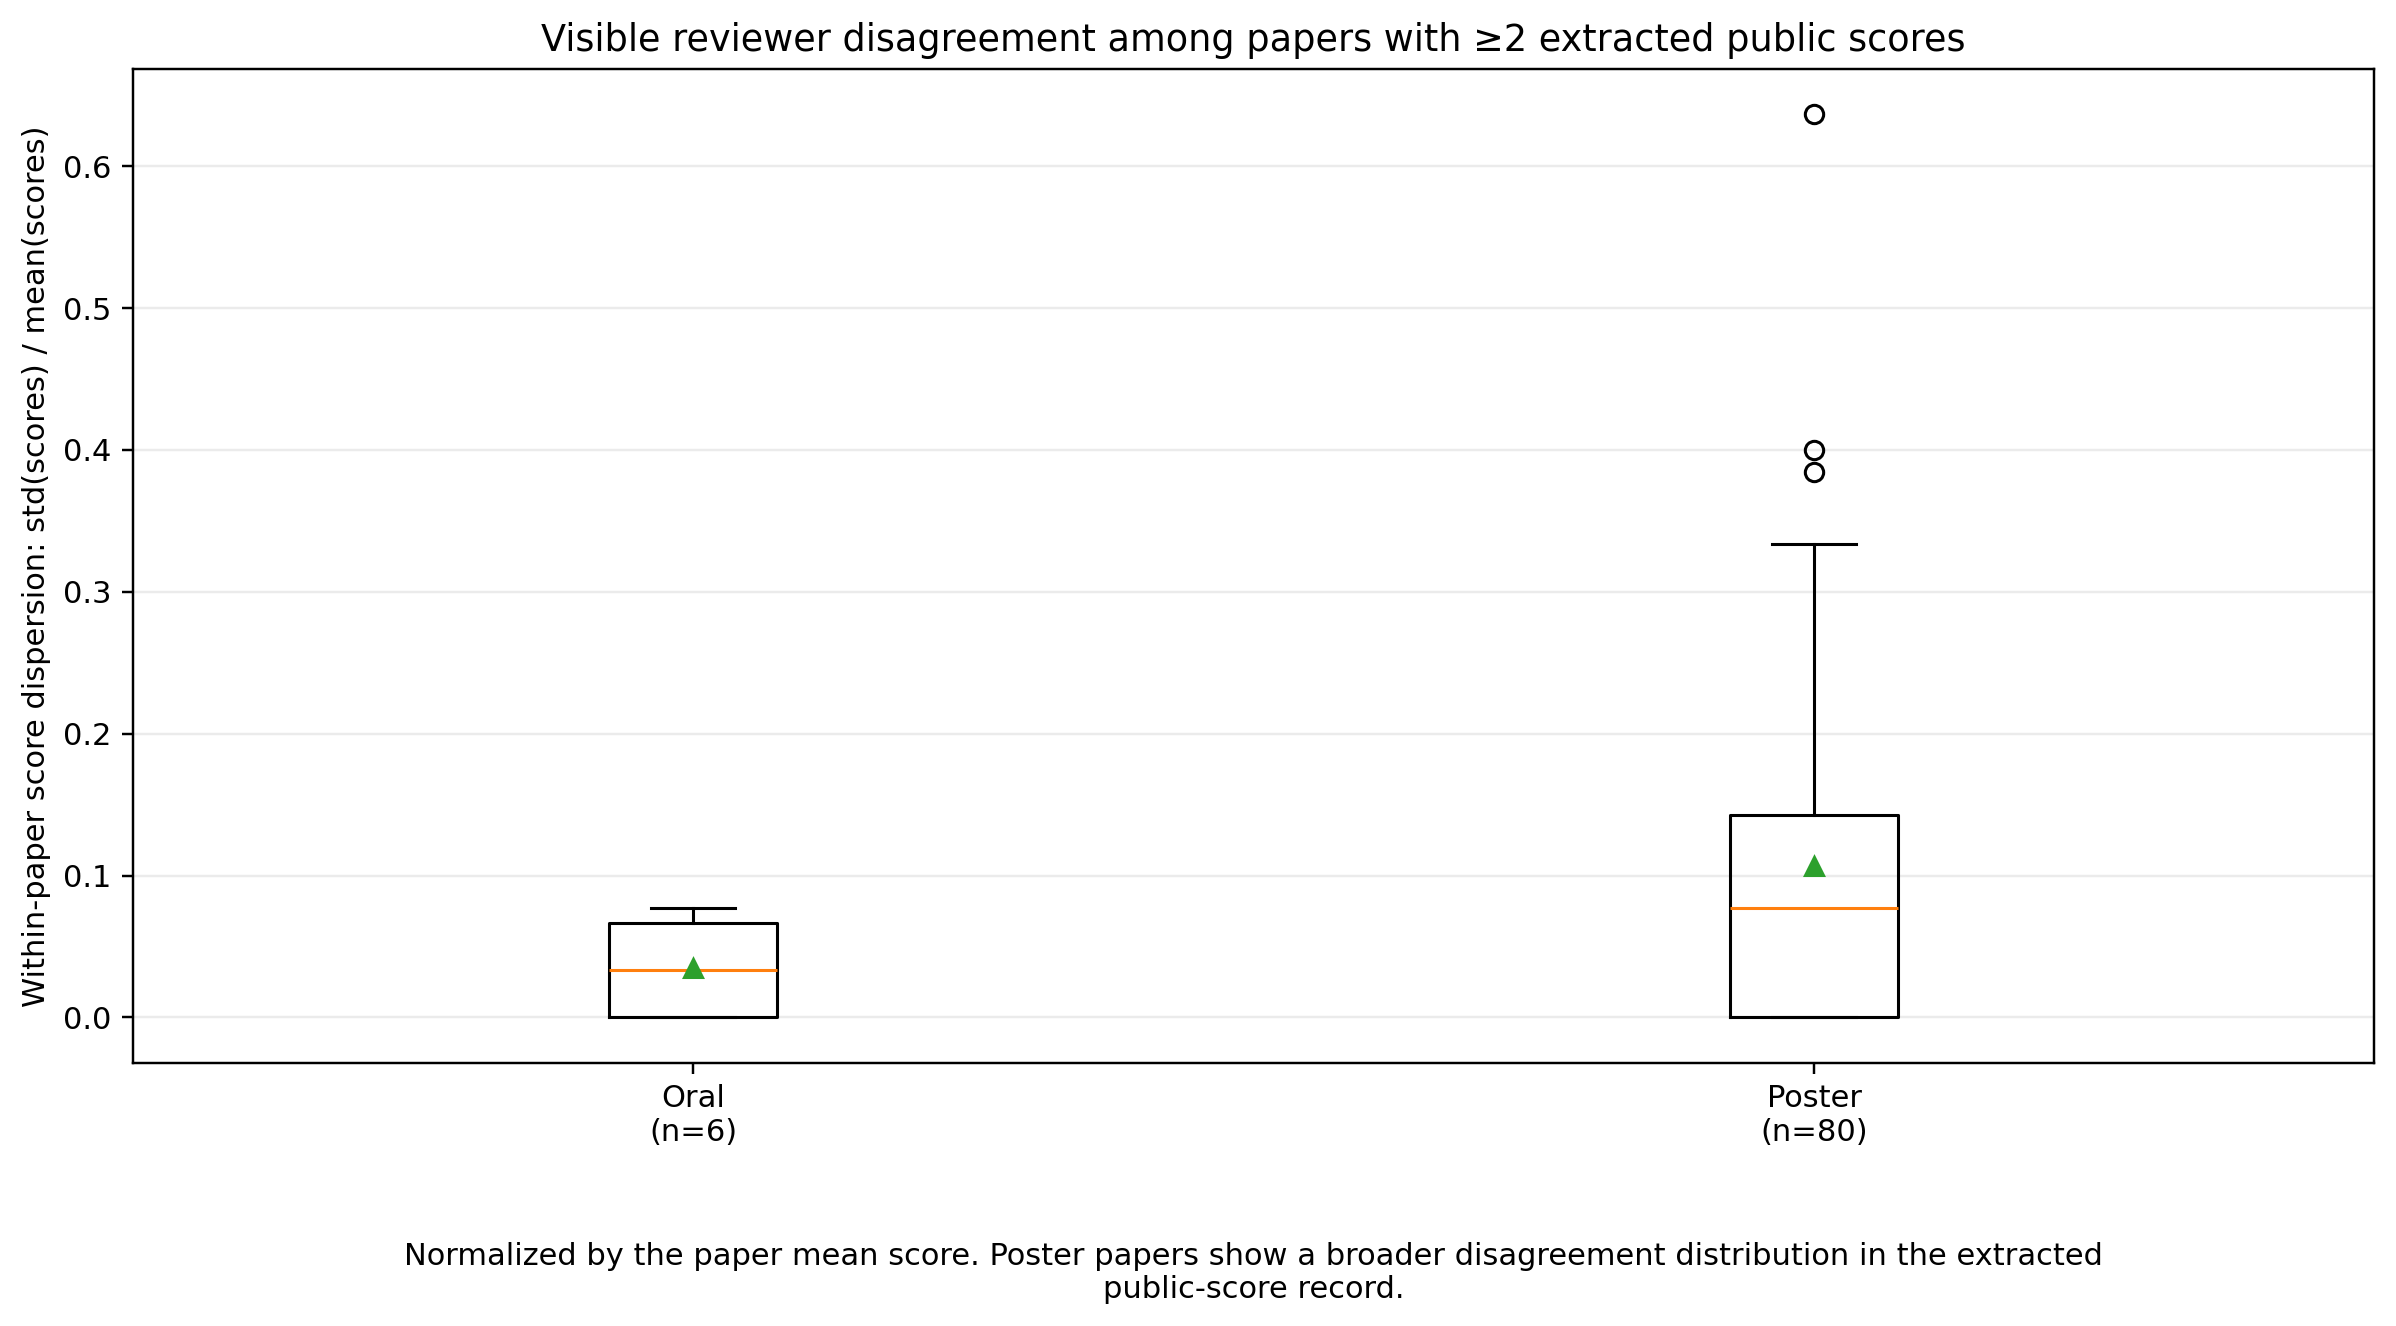
Within-paper score dispersion (standard deviation normalized by the paper’s mean score) for papers with at least two public scored reviews. Poster papers show a substantially broader disagreement distribution than orals, with several high-dispersion outliers.
These large spreads are not necessarily errors. They may indicate papers that are interesting but flawed, important but unclear, technically strong but poorly matched to one reviewer’s expertise, or simply reviewed by people with different calibrations. A score difference of five or seven points is a reminder that peer review is not a deterministic instrument. It is a social measurement process with noisy sensors.
For an accepted-paper sample, disagreement has an interesting interpretation. A paper with mixed scores can still be accepted if one reviewer sees strong value and another is skeptical, or if discussion resolves in favor of the paper’s contribution. The public scores alone cannot tell us which happened. But the existence of large disagreements tells us that some poster acceptances were not uniform consensus decisions — and the near-absence of those disagreements among orals tells us that oral selection drew from the low-disagreement end of the distribution too.
What can be inferred causally?
Not much, at least not cleanly. The distributions support associations, not causal claims.
The strongest association is between presentation type and the public score record. Oral papers have higher scores, a higher concentration of 8-plus reviews, and no public scores at or below 5. Posters have a lower mean, a 6-and-7 plateau, and tails on both sides.
It is reasonable to say that the public record is consistent with reviewer scores playing an important role in oral selection, and that oral papers appear to be drawn from the high-score, low-disagreement region of the accepted-paper distribution. But it would be too strong to say the scores caused the oral decisions, because we do not observe the full decision function. We do not observe rejected papers. We do not observe all private discussion. We do not know how reviewer confidence entered, how the organizers balanced topics, methods, scientific domains, or session composition, or whether some scores were missing from the public API view.
And because this is an accepted-paper-only dataset, we cannot estimate an acceptance threshold. This last point is easy to miss. Seeing many accepted poster reviews with scores of 6 or 7 does not mean that 6 or 7 was the acceptance threshold. To infer a threshold, we would need rejected papers too. Without them, we only see the selected side of the process.
What the tails reveal
The useful insight is therefore not causal. It is diagnostic.
The oral distribution looks like a compressed upper slice of the accepted population: high public scores, little visible disagreement, no weak-score tail. The poster distribution looks like a broad accepted population: mostly positive scores, but with enough low scores and enough high scores to show that the category is not homogeneous. Oral papers are not just posters with a slightly higher average score; they occupy a different part of the public score distribution. Posters, meanwhile, contain both near-oral-looking papers and papers that survived despite weaker or more mixed public reviews.
That makes the review process look less like a hard threshold and more like a triage problem under constraints. Some papers are clear candidates for oral presentation. Many are solid workshop papers. Some are controversial. Some are probably accepted because one reviewer or organizer saw value that a score histogram cannot encode.
A modest conclusion
The public OpenReview record for NeurIPS 2023 AI4Science gives a partial but informative view of the workshop’s accepted papers. Oral presentations received stronger and more compact public reviewer scores. Poster presentations were centered around 6 and 7, but with a visible lower tail, a non-negligible high-score tail, and occasional large reviewer disagreements.
The causal lesson is deliberately limited: public scores probably mattered, especially for oral selection, but they were not the whole decision process. The statistical lesson is more useful: accepted posters are a broad mixture, and oral papers appear to be selected from the high-score, low-disagreement end of that mixture.
That is the tale told by the two tails. One tail is almost missing. The other is doing a lot of work.
References
- NeurIPS 2023 AI4Science Workshop, accepted papers on OpenReview.